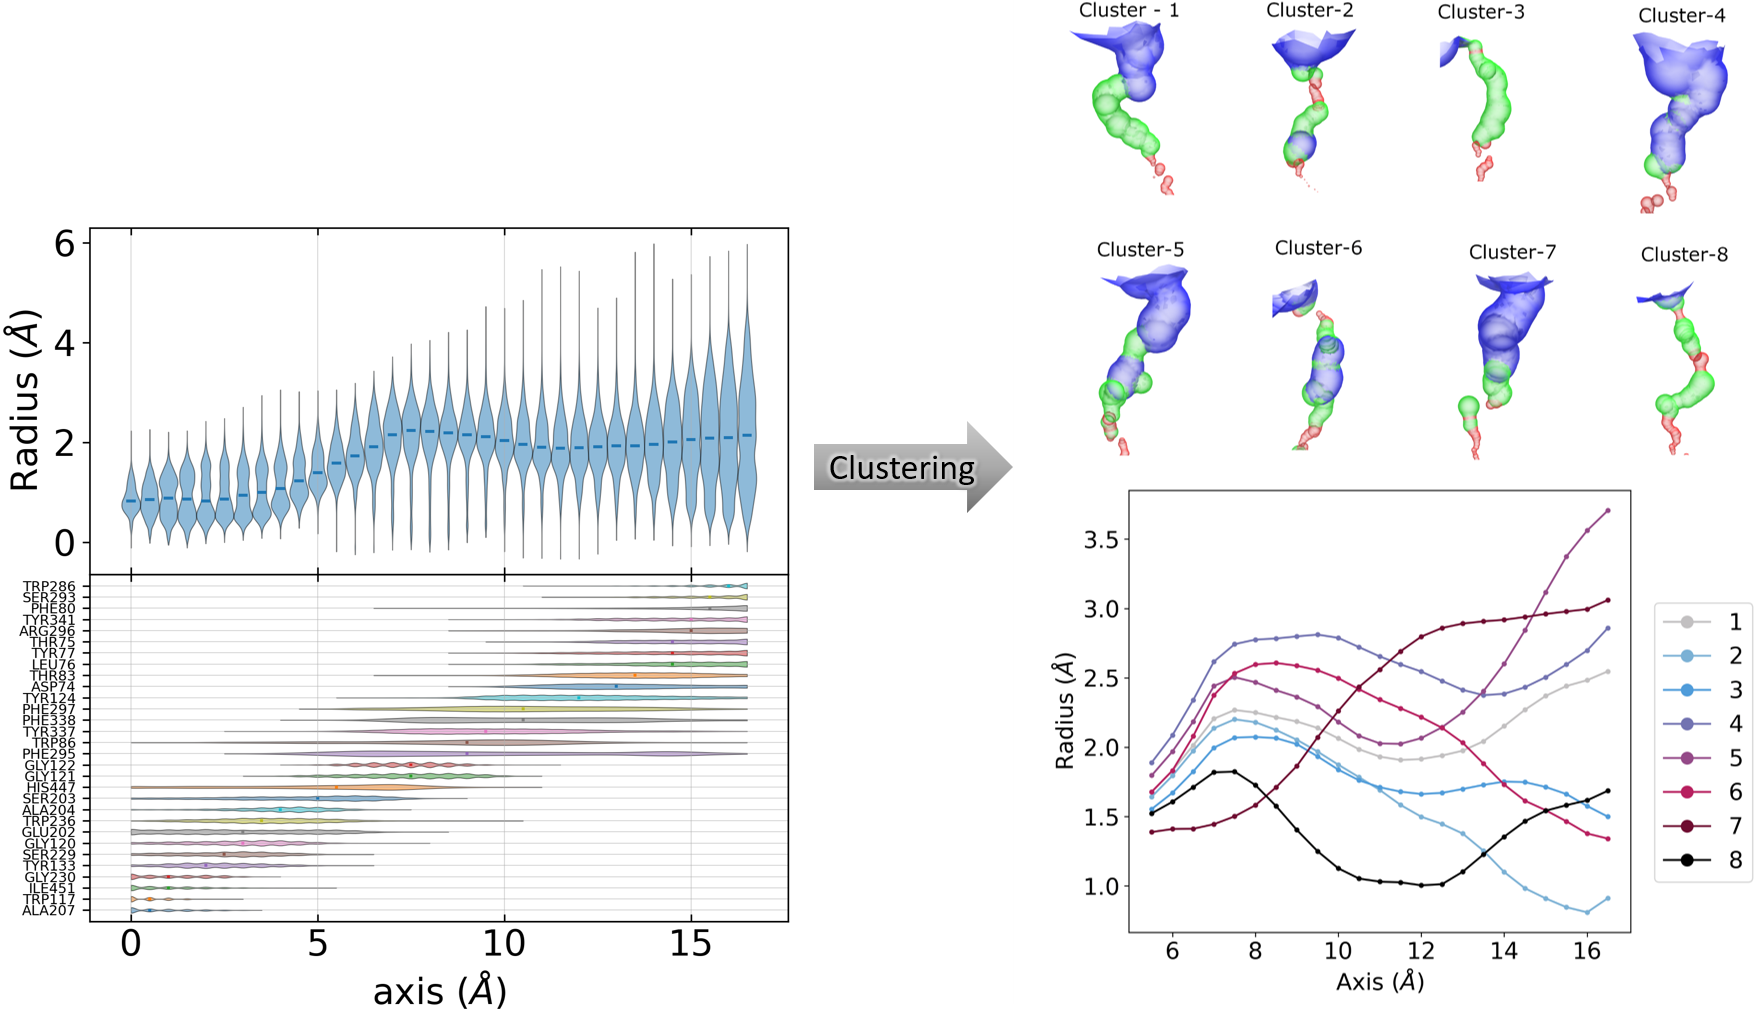
Clustering of ligand cavity shape
In this tutorial, we will perform clustering of ligand cavity. This tutorial can be used as a giude to perform protein channel shape clustering to analyse different shapes of channel during the simulations. The protein considered in this tutorial has ligand cavity burried deep inside the protein and cavity is almost linear.
Final result
Instructions
Tutorial files: The tutorial files can be downloaded from here.
Extract the files:
tar -zxvf protein-pca.tar.gzGo to directory:
cd protein-pcaCopy the Jupyter Notebook: This notebook is available in the GitHub repo. Download and copy it from the github.
Required Tools
GROMACS
gmx_clusterByFeatures
Steps
Preparation of reference structure
Generate a new trajectory aligned on reference structure
Plotting radius and residues distribution
Calculation of cavity/channel radius
Create feature-file
Clustering using radius as features
Analysis
1. Preparation of reference structure
A reference structure need to be prepared where cavity/channel axis align with one of the principal axis. For protein channel, it might be already done as channel-axis is mostly aligned along z-axis. In this case, I have already aligned the ligand-cavity axis along the Y-axis and it is provided as inputs/ref_cavity.pdb.
2. Generate a new trajectory superimposed on reference structure
gmx_clusterByFeatures hole has a functionality to superimpose the conformation for consistent calculation of cavity/channel radius along the given vector However, during clustering, the output central structures and cluster trajectory will be not superimposed and therefore, it is good to superimpose whole trajectory on reference structure so that cluster’s central structures orientations will be same as of reference structure.
We will use gmx trjconv to create a new superimposed trajectory with reference structre as follows.
[3]:
%%bash

rm traj_superimposed.xtc

echo 11 0 | gmx trjconv -s inputs/ref_cavity.pdb -f inputs/onlyProtein.xtc -n inputs/onlyProtein.ndx \
                        -fit rot+trans -o traj_superimposed.xtc
                     :-) GROMACS - gmx trjconv, 2025.2 (-:

Executable:   /opt/gromacs-2025/bin/gmx
Data prefix:  /opt/gromacs-2025
Working dir:  /home/raj/workspace/gmx_clusterByFeatrues/tutorials/protein-pca
Command line:
  gmx trjconv -s inputs/ref_cavity.pdb -f inputs/onlyProtein.xtc -n inputs/onlyProtein.ndx -fit rot+trans -o traj_superimposed.xtc

Will write xtc: Compressed trajectory (portable xdr format): xtc
WARNING: all CONECT records are ignored

WARNING: If there are molecules in the input trajectory file
         that are broken across periodic boundaries, they
         cannot be made whole (or treated as whole) without
         you providing a run input file.

Group     0 (         System) has  8327 elements
Group     1 (        Protein) has  8327 elements
Group     2 (      Protein-H) has  4217 elements
Group     3 (        C-alpha) has   542 elements
Group     4 (       Backbone) has  1626 elements
Group     5 (      MainChain) has  2169 elements
Group     6 (   MainChain+Cb) has  2660 elements
Group     7 (    MainChain+H) has  2668 elements
Group     8 (      SideChain) has  5659 elements
Group     9 (    SideChain-H) has  2048 elements
Group    10 (r_5-535_&_MainChain) has  2124 elements
Group    11 (r_5-535_&_MainChain_&_!r_72-85_&_!r_257-268_&_!r_338-352_&_!r_435-444) has  1920 elements
Group    12 (      r_79_&_CA) has     1 elements
Group    13 (     r_341_&_CA) has     1 elements
Group    14 (     r_293_&_CA) has     1 elements
Group    15 (r_10-535_&_MainChain) has  2104 elements
Group    16 (          r_203) has    11 elements
Group    17 (          r_447) has    18 elements
Group    18 (  oxyanion_hole) has    52 elements
Group    19 (    acyl_pocket) has    84 elements
Group    20 (   choline_site) has    45 elements
Group    21 (peripheral_site) has   106 elements
Select a group: Group     0 (         System) has  8327 elements
Group     1 (        Protein) has  8327 elements
Group     2 (      Protein-H) has  4217 elements
Group     3 (        C-alpha) has   542 elements
Group     4 (       Backbone) has  1626 elements
Group     5 (      MainChain) has  2169 elements
Group     6 (   MainChain+Cb) has  2660 elements
Group     7 (    MainChain+H) has  2668 elements
Group     8 (      SideChain) has  5659 elements
Group     9 (    SideChain-H) has  2048 elements
Group    10 (r_5-535_&_MainChain) has  2124 elements
Group    11 (r_5-535_&_MainChain_&_!r_72-85_&_!r_257-268_&_!r_338-352_&_!r_435-444) has  1920 elements
Group    12 (      r_79_&_CA) has     1 elements
Group    13 (     r_341_&_CA) has     1 elements
Group    14 (     r_293_&_CA) has     1 elements
Group    15 (r_10-535_&_MainChain) has  2104 elements
Group    16 (          r_203) has    11 elements
Group    17 (          r_447) has    18 elements
Group    18 (  oxyanion_hole) has    52 elements
Group    19 (    acyl_pocket) has    84 elements
Group    20 (   choline_site) has    45 elements
Group    21 (peripheral_site) has   106 elements
Reading frame       0 time    0.000
Precision of inputs/onlyProtein.xtc is 0.001 (nm)
Using output precision of 0.001 (nm)
Reading frame   22000 time 2200000.000    ->  frame  21999 time 2199900.000

Last written: frame  22500 time 2250000.000


GROMACS reminds you: "We can make it into a friend class. But I don't like having friends." (Joe Jordan)
Note that major changes are planned in future for trjconv, to improve usability and utility.

WARNING: Masses and atomic (Van der Waals) radii will be guessed
         based on residue and atom names, since they could not be
         definitively assigned from the information in your input
         files. These guessed numbers might deviate from the mass
         and radius of the atom type. Please check the output
         files if necessary. Note, that this functionality may
         be removed in a future GROMACS version. Please, consider
         using another file format for your input.

Select group for least squares fit
Selected 11: 'r_5-535_&_MainChain_&_!r_72-85_&_!r_257-268_&_!r_338-352_&_!r_435-444'
Select group for output
Selected 0: 'System'
3. Calculation of cavity/channel radius
We will use HOLE2 tool to calculate ligand cavity. It should be installed and hole should be in PATH. HOLE accept only one pdb file as input. gmx_clusterByFeatures hole use external hole and calculate radius from each frame automating the entire calculation for the trajectory.
Following options are used here:
-catmid 1903- seed atom from where radius calculation will start in both the direction along the axis-rad bondi- radius of atoms-cvect 0 1 0- vector along which radius will be calculated. Here, it is Y-axis.-endrad 12- stop radius calculation when this threshold radius is reached. It means, now it is in solvent phase.-sample 0.5- slab size along the cavity/channel axis. Radius is calculated in each slab-mcstep 2000- Monte-Carlo step size. See details in HOLE manual
This command will dump radius data as a function of time in radius.dat file
[1]:
%%bash

rm radius.dat

echo 11 1 | gmx_clusterByFeatures hole -f traj_superimposed.xtc -s inputs/ref_cavity.pdb -n inputs/onlyProtein.ndx \
                                       -rad bondi -catmid 1903 -cvect 0 1 0 -endrad 12 -sample 0.5 -mcstep 2000
 :-) GROMACS - gmx_clusterByFeatures hole, 2025.0-dev-20250210-6949615-local (-:

Executable:   gmx_clusterByFeatures hole
Data prefix:  /project/external/gmx_installed
Working dir:  /home/raj/workspace/gmx_clusterByFeatrues/tutorials/protein-pca
Command line:
  'gmx_clusterByFeatures hole' -f traj_superimposed.xtc -s inputs/ref_cavity.pdb -n inputs/onlyProtein.ndx -rad bondi -catmid 1903 -cvect 0 1 0 -endrad 12 -sample 0.5 -mcstep 2000


        :-)  gmx_clusterByFeatures hole (-:

        Author: Rajendra Kumar

        Copyright (C) 2018-2025  Rajendra Kumar


        gmx_clusterByFeatures is a free software: you can redistribute it and/or modify
        it under the terms of the GNU General Public License as published by
        the Free Software Foundation, either version 3 of the License, or
        (at your option) any later version.

        gmx_clusterByFeatures is distributed in the hope that it will be useful,
        but WITHOUT ANY WARRANTY; without even the implied warranty of
        MERCHANTABILITY or FITNESS FOR A PARTICULAR PURPOSE.  See the
        GNU General Public License for more details.

        You should have received a copy of the GNU General Public License
        along with gmx_clusterByFeatures.  If not, see <http://www.gnu.org/licenses/>.

        THIS SOFTWARE IS PROVIDED BY THE COPYRIGHT HOLDERS AND CONTRIBUTORS
        "AS IS" AND ANY EXPRESS OR IMPLIED WARRANTIES, INCLUDING, BUT NOT
        LIMITED TO, THE IMPLIED WARRANTIES OF MERCHANTABILITY AND FITNESS FOR
        A PARTICULAR PURPOSE ARE DISCLAIMED. IN NO EVENT SHALL THE COPYRIGHT
        OWNER OR CONTRIBUTORS BE LIABLE FOR ANY DIRECT, INDIRECT, INCIDENTAL,
        SPECIAL, EXEMPLARY, OR CONSEQUENTIAL DAMAGES (INCLUDING, BUT NOT LIMITED
        TO, PROCUREMENT OF SUBSTITUTE GOODS OR SERVICES; LOSS OF USE, DATA, OR
        PROFITS; OR BUSINESS INTERRUPTION) HOWEVER CAUSED AND ON ANY THEORY OF
        LIABILITY, WHETHER IN CONTRACT, STRICT LIABILITY, OR TORT (INCLUDING
        NEGLIGENCE OR OTHERWISE) ARISING IN ANY WAY OUT OF THE USE OF THIS
        SOFTWARE, EVEN IF ADVISED OF THE POSSIBILITY OF SUCH DAMAGE.

WARNING: all CONECT records are ignored
Group     0 (         System) has  8327 elements
Group     1 (        Protein) has  8327 elements
Group     2 (      Protein-H) has  4217 elements
Group     3 (        C-alpha) has   542 elements
Group     4 (       Backbone) has  1626 elements
Group     5 (      MainChain) has  2169 elements
Group     6 (   MainChain+Cb) has  2660 elements
Group     7 (    MainChain+H) has  2668 elements
Group     8 (      SideChain) has  5659 elements
Group     9 (    SideChain-H) has  2048 elements
Group    10 (r_5-535_&_MainChain) has  2124 elements
Group    11 (r_5-535_&_MainChain_&_!r_72-85_&_!r_257-268_&_!r_338-352_&_!r_435-444) has  1920 elements
Group    12 (      r_79_&_CA) has     1 elements
Group    13 (     r_341_&_CA) has     1 elements
Group    14 (     r_293_&_CA) has     1 elements
Group    15 (r_10-535_&_MainChain) has  2104 elements
Group    16 (          r_203) has    11 elements
Group    17 (          r_447) has    18 elements
Group    18 (  oxyanion_hole) has    52 elements
Group    19 (    acyl_pocket) has    84 elements
Group    20 (   choline_site) has    45 elements
Group    21 (peripheral_site) has   106 elements
Select a group: Group     0 (         System) has  8327 elements
Group     1 (        Protein) has  8327 elements
Group     2 (      Protein-H) has  4217 elements
Group     3 (        C-alpha) has   542 elements
Group     4 (       Backbone) has  1626 elements
Group     5 (      MainChain) has  2169 elements
Group     6 (   MainChain+Cb) has  2660 elements
Group     7 (    MainChain+H) has  2668 elements
Group     8 (      SideChain) has  5659 elements
Group     9 (    SideChain-H) has  2048 elements
Group    10 (r_5-535_&_MainChain) has  2124 elements
Group    11 (r_5-535_&_MainChain_&_!r_72-85_&_!r_257-268_&_!r_338-352_&_!r_435-444) has  1920 elements
Group    12 (      r_79_&_CA) has     1 elements
Group    13 (     r_341_&_CA) has     1 elements
Group    14 (     r_293_&_CA) has     1 elements
Group    15 (r_10-535_&_MainChain) has  2104 elements
Group    16 (          r_203) has    11 elements
Group    17 (          r_447) has    18 elements
Group    18 (  oxyanion_hole) has    52 elements
Group    19 (    acyl_pocket) has    84 elements
Group    20 (   choline_site) has    45 elements
Group    21 (peripheral_site) has   106 elements
Reading frame   22000 time 2200000.000
-------- -------- ------------------- -------- ----------
O.S. Smart, J.M. Goodfellow and B.A. Wallace (1993)
The Pore Dimensions of Gramicidin A
Biophysical Journal 65:2455-2460.
-------- -------- ------------------- -------- ----------

GROMACS reminds you: "Never replicate a successful experiment." (Fett's law.)
Choose a group for the least squares fit
Selected 11: 'r_5-535_&_MainChain_&_!r_72-85_&_!r_257-268_&_!r_338-352_&_!r_435-444'

Choose a group for hole calculation...
Selected 1: 'Protein'


Selected "H" atom of "GLY-122" as seed for channel/cavity

Thanks for using gmx_hole!!!

++++ PLEASE READ AND CITE THE FOLLOWING REFERENCE ++++
4. Plotting radius and residues distribution
To plot radius value distributions and residues outlining cavity/channel positions distribution over the simulations, gmx_clusterByFeatures holeplot sub-command can be used. It reads radius file generated in the above command, extract radius values for the given segment of the cavity/channel, calculate average/distributions and plot it as a function of cavity/channel axis.
Options
-resplot- enable plotting of residues positions distributions-vplot- distributions are plotted as violin-plot-xmin- minimum value of cavity/channel axis position to consider-xmax- maximum value of cavity/channel axis position to consider-endrad- ignore if radius is greater than this value (mostly at the opening end)-gap- slab size along the cavity/channel-ax- X, Y or Z axis along which cavity/channel axis is aligned-rlsize- font-size of residues in residue-distribution plots.
[1]:
%%bash

gmx_clusterByFeatures holeplot -i radius.dat -resplot -vplot -o average_radius_distribution.png \
                               -xmin 0 -xmax 17 -endrad 6 -gap 0.5 -ax Y -rlsize 7
Reading file : radius.dat
Reading frame 0 at time        0.000
Maximum axis range is: (0.000 to 17.000)
Reading frame 20000 at time  2000000.000
Finishid reading.... Total number of frame read =  22501
After removing axis points with any missing data:
------------------------------------------------------------
#        Axis        Mean radius     Std. deviation
------------------------------------------------------------
       0.000            0.864            0.286
       0.500            0.867            0.336
       1.000            0.889            0.394
       1.500            0.904            0.442
       2.000            0.920            0.460
       2.500            0.958            0.449
       3.000            0.993            0.455
       3.500            1.043            0.466
       4.000            1.144            0.448
       4.500            1.288            0.414
       5.000            1.449            0.386
       5.500            1.614            0.387
       6.000            1.750            0.451
       6.500            1.907            0.534
       7.000            2.081            0.594
       7.500            2.146            0.631
       8.000            2.142            0.637
       8.500            2.127            0.610
       9.000            2.111            0.581
       9.500            2.085            0.569
      10.000            2.036            0.571
      10.500            1.984            0.567
      11.000            1.948            0.559
      11.500            1.925            0.561
      12.000            1.915            0.571
      12.500            1.916            0.574
      13.000            1.925            0.572
      13.500            1.938            0.595
      14.000            1.963            0.646
      14.500            2.001            0.715
      15.000            2.049            0.796
      15.500            2.088            0.884
      16.000            2.113            0.965
      16.500            2.178            1.044
------------------------------------------------------------

Observations
As can be seen aboive, radius of cavity flucuated by at-least 2Å and much more along the cavity. Therefore, it does not provide a true picture of different shapes sampled during the simulations. Clustering could unravel all those shapes sampled during the simulations.
5. Create feature file
In the next step, we will create a file containing cavity radius as features for clustering. gmx_clusterByFeatures holefeatures can be used to create this file using the input radius.dat file, which is obtained in the previous step.
Options
-xminMinimum axis position value above which radius will be considered. Here, we take it as 5.5 because GLY122 is present at the bottom most region of the cavity and residue-distribution shows that GLY122 postions start from 5.5Å along the axis.-xmaxMaximum axis position value below which radius will be considered-endradMaximum radius to be considered for opening end of the cavity-gapRadius calculation slab size-axCavity/Channel axis
[2]:
%%bash

gmx_clusterByFeatures holefeatures -i radius.dat -o cavity_features.xvg \
                                   -xmin 5.5 -xmax 17 -endrad 6 -gap 0.5 -ax Y
Reading file : radius.dat
Reading frame 0 at time        0.000
Maximum axis range is: (5.500 to 17.000)
Reading frame 20000 at time  2000000.000
Finishid reading.... Total number of frame read =  22501
After removing axis points with any missing data:
------------------------------------------------------------
#        Axis        Mean radius     Std. deviation
------------------------------------------------------------
       5.500            1.629            0.384
       6.000            1.750            0.451
       6.500            1.907            0.534
       7.000            2.081            0.594
       7.500            2.146            0.631
       8.000            2.142            0.637
       8.500            2.127            0.610
       9.000            2.111            0.581
       9.500            2.085            0.569
      10.000            2.036            0.571
      10.500            1.984            0.567
      11.000            1.948            0.559
      11.500            1.925            0.561
      12.000            1.915            0.571
      12.500            1.916            0.574
      13.000            1.925            0.572
      13.500            1.938            0.595
      14.000            1.963            0.646
      14.500            2.001            0.715
      15.000            2.049            0.796
      15.500            2.088            0.884
      16.000            2.113            0.965
      16.500            2.178            1.044
------------------------------------------------------------
WARNING: radius value for the axis point was not calculated by hole. Zero will be written as feature value. However, large number of missing values will lead to wrong clustering. Therefore, please try to minimize or eliminate the missing values by changing axis-point range using xmin and xmax option and/or dataOccupancy option.
(23, 22501)
6. Clustering using radius as features
Now, we use radius as the features and perform clustering. We will use K-Means clustering. However, there is one drawback that the number of clusters should be known beforehand. gmx_clusterByFeatures implements several cluster metrics and also automatated way to decide number of clusters. We will use Elbow method to automatically
determine the number of clusters.
Following command will perform the clustering of conformations on the basis of cavity-radius profile. Explanation of options are as follows:
-method kmeans: Use K-Means clustering algorithm-ncluster 15: K-Means clustering will be performed for 1 upto 15 clusters times each time. Finally, based on-ssrchangeoption, final number of clusters will be automatically selected.-cmetric ssr-sst: Use Elbow method to decide final number of clusters.-nfeature 23: Take 23 features from the feature file. Here it is 23 slabs for which cavity radius is dumped in feature filecavity_features.xvg.-sort features: Sort the output clustered trajectory based on the distance in feature space from its central structure.-ssrchange 1.5: Threshold (percentage) of change in SSR/SST ratio in Elbow method to automatically decide the number of clusters.-g cluster.log: Log file containing clustering information and cluster-mterics.
index group order
First index group - Output group of atoms in the central structures
Second index group - Group of atoms to calculate RMSD between central conformations of clusters as RMSD matrix, which is dumped in the log file with
-goption. Here, it is Ligand without hydrogen atoms.Third index group - Used for Superimposition by least-square fitting. ONLY used in separate clustered trajectories to superimpose conformations on the central structure.
Content of the output ``-g clustering-radius.log`` file
It contains the command summary, and for each input cluster-numbers, number of frames in each clusters. At the end it dumps the Cluster Metrics Summary, which is important for deciding final number of clusters.
[3]:
%%bash

mkdir clustering-radius-output

echo 0 10 11 | gmx_clusterByFeatures cluster -f traj_superimposed.xtc -s inputs/ref_cavity.pdb -n inputs/onlyProtein.ndx \
                                            -feat cavity_features.xvg -method kmeans -nfeature 23 -cmetric ssr-sst -ssrchange 1.5 -ncluster 15 \
                                            -cpdb clustering-radius-output/central.pdb -g clustering-radius.log -clid cluster-id-radius.xvg
mkdir: cannot create directory ‘clustering-radius-output’: File exists
 :-) GROMACS - gmx_clusterByFeatures cluster, 2025.0-dev-20250210-6949615-local (-:

Executable:   gmx_clusterByFeatures cluster
Data prefix:  /project/external/gmx_installed
Working dir:  /home/raj/workspace/gmx_clusterByFeatrues/tutorials/protein-pca
Command line:
  'gmx_clusterByFeatures cluster' -f traj_superimposed.xtc -s inputs/ref_cavity.pdb -n inputs/onlyProtein.ndx -feat cavity_features.xvg -method kmeans -nfeature 23 -cmetric ssr-sst -ssrchange 1.5 -ncluster 15 -cpdb clustering-radius-output/central.pdb -g clustering-radius.log -clid cluster-id-radius.xvg


         :-)  gmx_clusterByFeatures cluster (-:

             Author: Rajendra Kumar

       Copyright (C) 2018-2019  Rajendra Kumar


gmx_clusterByFeatures is a free software: you can redistribute it and/or modify
it under the terms of the GNU General Public License as published by
the Free Software Foundation, either version 3 of the License, or
(at your option) any later version.

gmx_clusterByFeatures is distributed in the hope that it will be useful,
but WITHOUT ANY WARRANTY; without even the implied warranty of
MERCHANTABILITY or FITNESS FOR A PARTICULAR PURPOSE.  See the
GNU General Public License for more details.

You should have received a copy of the GNU General Public License
along with gmx_clusterByFeatures.  If not, see <http://www.gnu.org/licenses/>.

THIS SOFTWARE IS PROVIDED BY THE COPYRIGHT HOLDERS AND CONTRIBUTORS
"AS IS" AND ANY EXPRESS OR IMPLIED WARRANTIES, INCLUDING, BUT NOT
LIMITED TO, THE IMPLIED WARRANTIES OF MERCHANTABILITY AND FITNESS FOR
A PARTICULAR PURPOSE ARE DISCLAIMED. IN NO EVENT SHALL THE COPYRIGHT
OWNER OR CONTRIBUTORS BE LIABLE FOR ANY DIRECT, INDIRECT, INCIDENTAL,
SPECIAL, EXEMPLARY, OR CONSEQUENTIAL DAMAGES (INCLUDING, BUT NOT LIMITED
TO, PROCUREMENT OF SUBSTITUTE GOODS OR SERVICES; LOSS OF USE, DATA, OR
PROFITS; OR BUSINESS INTERRUPTION) HOWEVER CAUSED AND ON ANY THEORY OF
LIABILITY, WHETHER IN CONTRACT, STRICT LIABILITY, OR TORT (INCLUDING
NEGLIGENCE OR OTHERWISE) ARISING IN ANY WAY OUT OF THE USE OF THIS
SOFTWARE, EVEN IF ADVISED OF THE POSSIBILITY OF SUCH DAMAGE.


Back Off! I just backed up clustering-radius.log to ./#clustering-radius.log.2#
WARNING: all CONECT records are ignored
Group     0 (         System) has  8327 elements
Group     1 (        Protein) has  8327 elements
Group     2 (      Protein-H) has  4217 elements
Group     3 (        C-alpha) has   542 elements
Group     4 (       Backbone) has  1626 elements
Group     5 (      MainChain) has  2169 elements
Group     6 (   MainChain+Cb) has  2660 elements
Group     7 (    MainChain+H) has  2668 elements
Group     8 (      SideChain) has  5659 elements
Group     9 (    SideChain-H) has  2048 elements
Group    10 (r_5-535_&_MainChain) has  2124 elements
Group    11 (r_5-535_&_MainChain_&_!r_72-85_&_!r_257-268_&_!r_338-352_&_!r_435-444) has  1920 elements
Group    12 (      r_79_&_CA) has     1 elements
Group    13 (     r_341_&_CA) has     1 elements
Group    14 (     r_293_&_CA) has     1 elements
Group    15 (r_10-535_&_MainChain) has  2104 elements
Group    16 (          r_203) has    11 elements
Group    17 (          r_447) has    18 elements
Group    18 (  oxyanion_hole) has    52 elements
Group    19 (    acyl_pocket) has    84 elements
Group    20 (   choline_site) has    45 elements
Group    21 (peripheral_site) has   106 elements
Select a group: Group     0 (         System) has  8327 elements
Group     1 (        Protein) has  8327 elements
Group     2 (      Protein-H) has  4217 elements
Group     3 (        C-alpha) has   542 elements
Group     4 (       Backbone) has  1626 elements
Group     5 (      MainChain) has  2169 elements
Group     6 (   MainChain+Cb) has  2660 elements
Group     7 (    MainChain+H) has  2668 elements
Group     8 (      SideChain) has  5659 elements
Group     9 (    SideChain-H) has  2048 elements
Group    10 (r_5-535_&_MainChain) has  2124 elements
Group    11 (r_5-535_&_MainChain_&_!r_72-85_&_!r_257-268_&_!r_338-352_&_!r_435-444) has  1920 elements
Group    12 (      r_79_&_CA) has     1 elements
Group    13 (     r_341_&_CA) has     1 elements
Group    14 (     r_293_&_CA) has     1 elements
Group    15 (r_10-535_&_MainChain) has  2104 elements
Group    16 (          r_203) has    11 elements
Group    17 (          r_447) has    18 elements
Group    18 (  oxyanion_hole) has    52 elements
Group    19 (    acyl_pocket) has    84 elements
Group    20 (   choline_site) has    45 elements
Group    21 (peripheral_site) has   106 elements
Reading frame       4 time  400.000
=======================
  Cluster Log output
=======================

Command:
=======================
'gmx_clusterByFeatures cluster' -f traj_superimposed.xtc -s inputs/ref_cavity.pdb -n inputs/onlyProtein.ndx -feat cavity_features.xvg -method kmeans -nfeature 23 -cmetric ssr-sst -ssrchange 1.5 -ncluster 15 -cpdb clustering-radius-output/central.pdb -g clustering-radius.log -clid cluster-id-radius.xvg
=======================

Choose a group for the output:
Selected 0: 'System'

Choose a group for clustering/RMSD calculation:
Selected 10: 'r_5-535_&_MainChain'

Choose a group for fitting or superposition:
Selected 11: 'r_5-535_&_MainChain_&_!r_72-85_&_!r_257-268_&_!r_338-352_&_!r_435-444'


 Input Trajectory dt = 100 ps


###########################################
########## NUMBER OF CLUSTERS : 1 ########
###########################################

===========================
Cluster-ID      TotalFrames
1               22501
===========================


###########################################
########## NUMBER OF CLUSTERS : 2 ########
###########################################

===========================
Cluster-ID      TotalFrames
1               11602
2               10899
===========================


###########################################
########## NUMBER OF CLUSTERS : 3 ########
###########################################

===========================
Cluster-ID      TotalFrames
1               10730
2               9339
3               2432
===========================


###########################################
########## NUMBER OF CLUSTERS : 4 ########
###########################################

===========================
Cluster-ID      TotalFrames
1               6985
2               6795
3               6561
4               2160
===========================


###########################################
########## NUMBER OF CLUSTERS : 5 ########
###########################################

===========================
Cluster-ID      TotalFrames
1               6529
2               6088
3               5529
4               2354
5               2001
===========================


###########################################
########## NUMBER OF CLUSTERS : 6 ########
###########################################

===========================
Cluster-ID      TotalFrames
1               5775
2               5088
3               4794
4               3109
5               1922
6               1813
===========================


###########################################
########## NUMBER OF CLUSTERS : 7 ########
###########################################

===========================
Cluster-ID      TotalFrames
1               5268
2               4624
3               3265
4               3174
5               2646
6               1767
7               1757
===========================


###########################################
########## NUMBER OF CLUSTERS : 8 ########
###########################################

===========================
Cluster-ID      TotalFrames
1               4331
2               3408
3               3075
4               2879
5               2867
6               2719
7               1742
8               1480
===========================


###########################################
########## NUMBER OF CLUSTERS : 9 ########
###########################################

===========================
Cluster-ID      TotalFrames
1               4341
2               3427
3               3083
4               2782
5               2730
6               2683
7               1495
8               1139
9               821
===========================


###########################################
########## NUMBER OF CLUSTERS : 10 ########
###########################################

===========================
Cluster-ID      TotalFrames
1               4230
2               3259
3               3048
4               2659
5               2538
6               2271
7               1482
8               1405
9               811
10              798
===========================


###########################################
########## NUMBER OF CLUSTERS : 11 ########
###########################################

===========================
Cluster-ID      TotalFrames
1               3098
2               3006
3               2976
4               2940
5               2501
6               2009
7               1538
8               1443
9               1405
10              794
11              791
===========================


###########################################
########## NUMBER OF CLUSTERS : 12 ########
###########################################

===========================
Cluster-ID      TotalFrames
1               3011
2               2996
3               2735
4               2691
5               2073
6               1907
7               1489
8               1396
9               1320
10              1302
11              795
12              786
===========================


###########################################
########## NUMBER OF CLUSTERS : 13 ########
###########################################

===========================
Cluster-ID      TotalFrames
1               2946
2               2685
3               2572
4               2233
5               1988
6               1916
7               1596
8               1373
9               1326
10              1191
11              1105
12              792
13              778
===========================


###########################################
########## NUMBER OF CLUSTERS : 14 ########
###########################################

===========================
Cluster-ID      TotalFrames
1               2910
2               2698
3               2431
4               2107
5               1946
6               1919
7               1618
8               1393
9               1392
10              1218
11              919
12              734
13              733
14              483
===========================


###########################################
########## NUMBER OF CLUSTERS : 15 ########
###########################################

===========================
Cluster-ID      TotalFrames
1               2508
2               2322
3               2069
4               1926
5               1917
6               1676
7               1668
8               1555
9               1350
10              1319
11              1285
12              944
13              752
14              723
15              487
===========================


===========================================================================================================
                                          Cluster Metrics Summary
-----------------------------------------------------------------------------------------------------------
Clusters       SSR/SST    D(SSR/SST)         (Psuedo)F-stat.    Silhouette-score   Davies-bouldin-score
2              39.50      39.503                  14691.213     0.347              1.121
3              50.59      11.086                  11517.190     0.337              1.117
4              57.15       6.563                  10002.451     0.240              1.329
5              62.30       5.150                   9294.526     0.241              1.271
6              65.75       3.452                   8638.371     0.239              1.232
7              68.68       2.930                   8222.448     0.231              1.272
8              70.67       1.983                   7741.149     0.212              1.304
9              72.57       1.902                   7437.596     0.218              1.263
10             74.22       1.647                   7192.800     0.218              1.202
11             75.34       1.123                   6870.415     0.209              1.273
12             76.28       0.946                   6576.296     0.202              1.314
13             77.03       0.750                   6286.124     0.200              1.299
14             77.87       0.837                   6087.276     0.201              1.297
15             78.54       0.671                   5879.271     0.196              1.331
===========================================================================================================


#####################################
Final number of cluster selected: 10
#####################################

Calculating central structure for cluster-10 ...
Reading frame       9 time 407500.000
Back Off! I just backed up cluster-id-radius.xvg to ./#cluster-id-radius.xvg.2#
Reading frame       9 time 407500.000
GROMACS reminds you: "Christianity may be OK between consenting adults in private but should not be taught to young children." (Francis Crick)
===========================================
Cluster-ID      Central Frame   Total Frames
1               19488           4230
2               9807            3259
3               1873            3048
4               14884           2659
5               20134           2538
6               13371           2271
7               22103           1482
8               2417            1405
9               21652           811
10              4075            798
===========================================


Extracting coordinates of the central structure...


Calculating RMSD between central structures...


=====================================
 Central structurs - RMSD matrix
=====================================
    c1     c2     c3     c4     c5     c6     c7     c8     c9    c10
 0.000  0.162  0.219  0.173  0.115  0.213  0.169  0.242  0.167  0.233
 0.162  0.000  0.172  0.174  0.160  0.148  0.159  0.184  0.161  0.183
 0.219  0.172  0.000  0.231  0.221  0.188  0.190  0.142  0.204  0.154
 0.173  0.174  0.231  0.000  0.166  0.220  0.162  0.241  0.169  0.230
 0.115  0.160  0.221  0.166  0.000  0.213  0.164  0.247  0.159  0.242
 0.213  0.148  0.188  0.220  0.213  0.000  0.214  0.175  0.208  0.174
 0.169  0.159  0.190  0.162  0.164  0.214  0.000  0.213  0.127  0.211
 0.242  0.184  0.142  0.241  0.247  0.175  0.213  0.000  0.229  0.140
 0.167  0.161  0.204  0.169  0.159  0.208  0.127  0.229  0.000  0.225
 0.233  0.183  0.154  0.230  0.242  0.174  0.211  0.140  0.225  0.000
=====================================


Writing central structure to pdb-files...
7. Analysis and visualizations
Now, we will perform few analysis and visualizations.
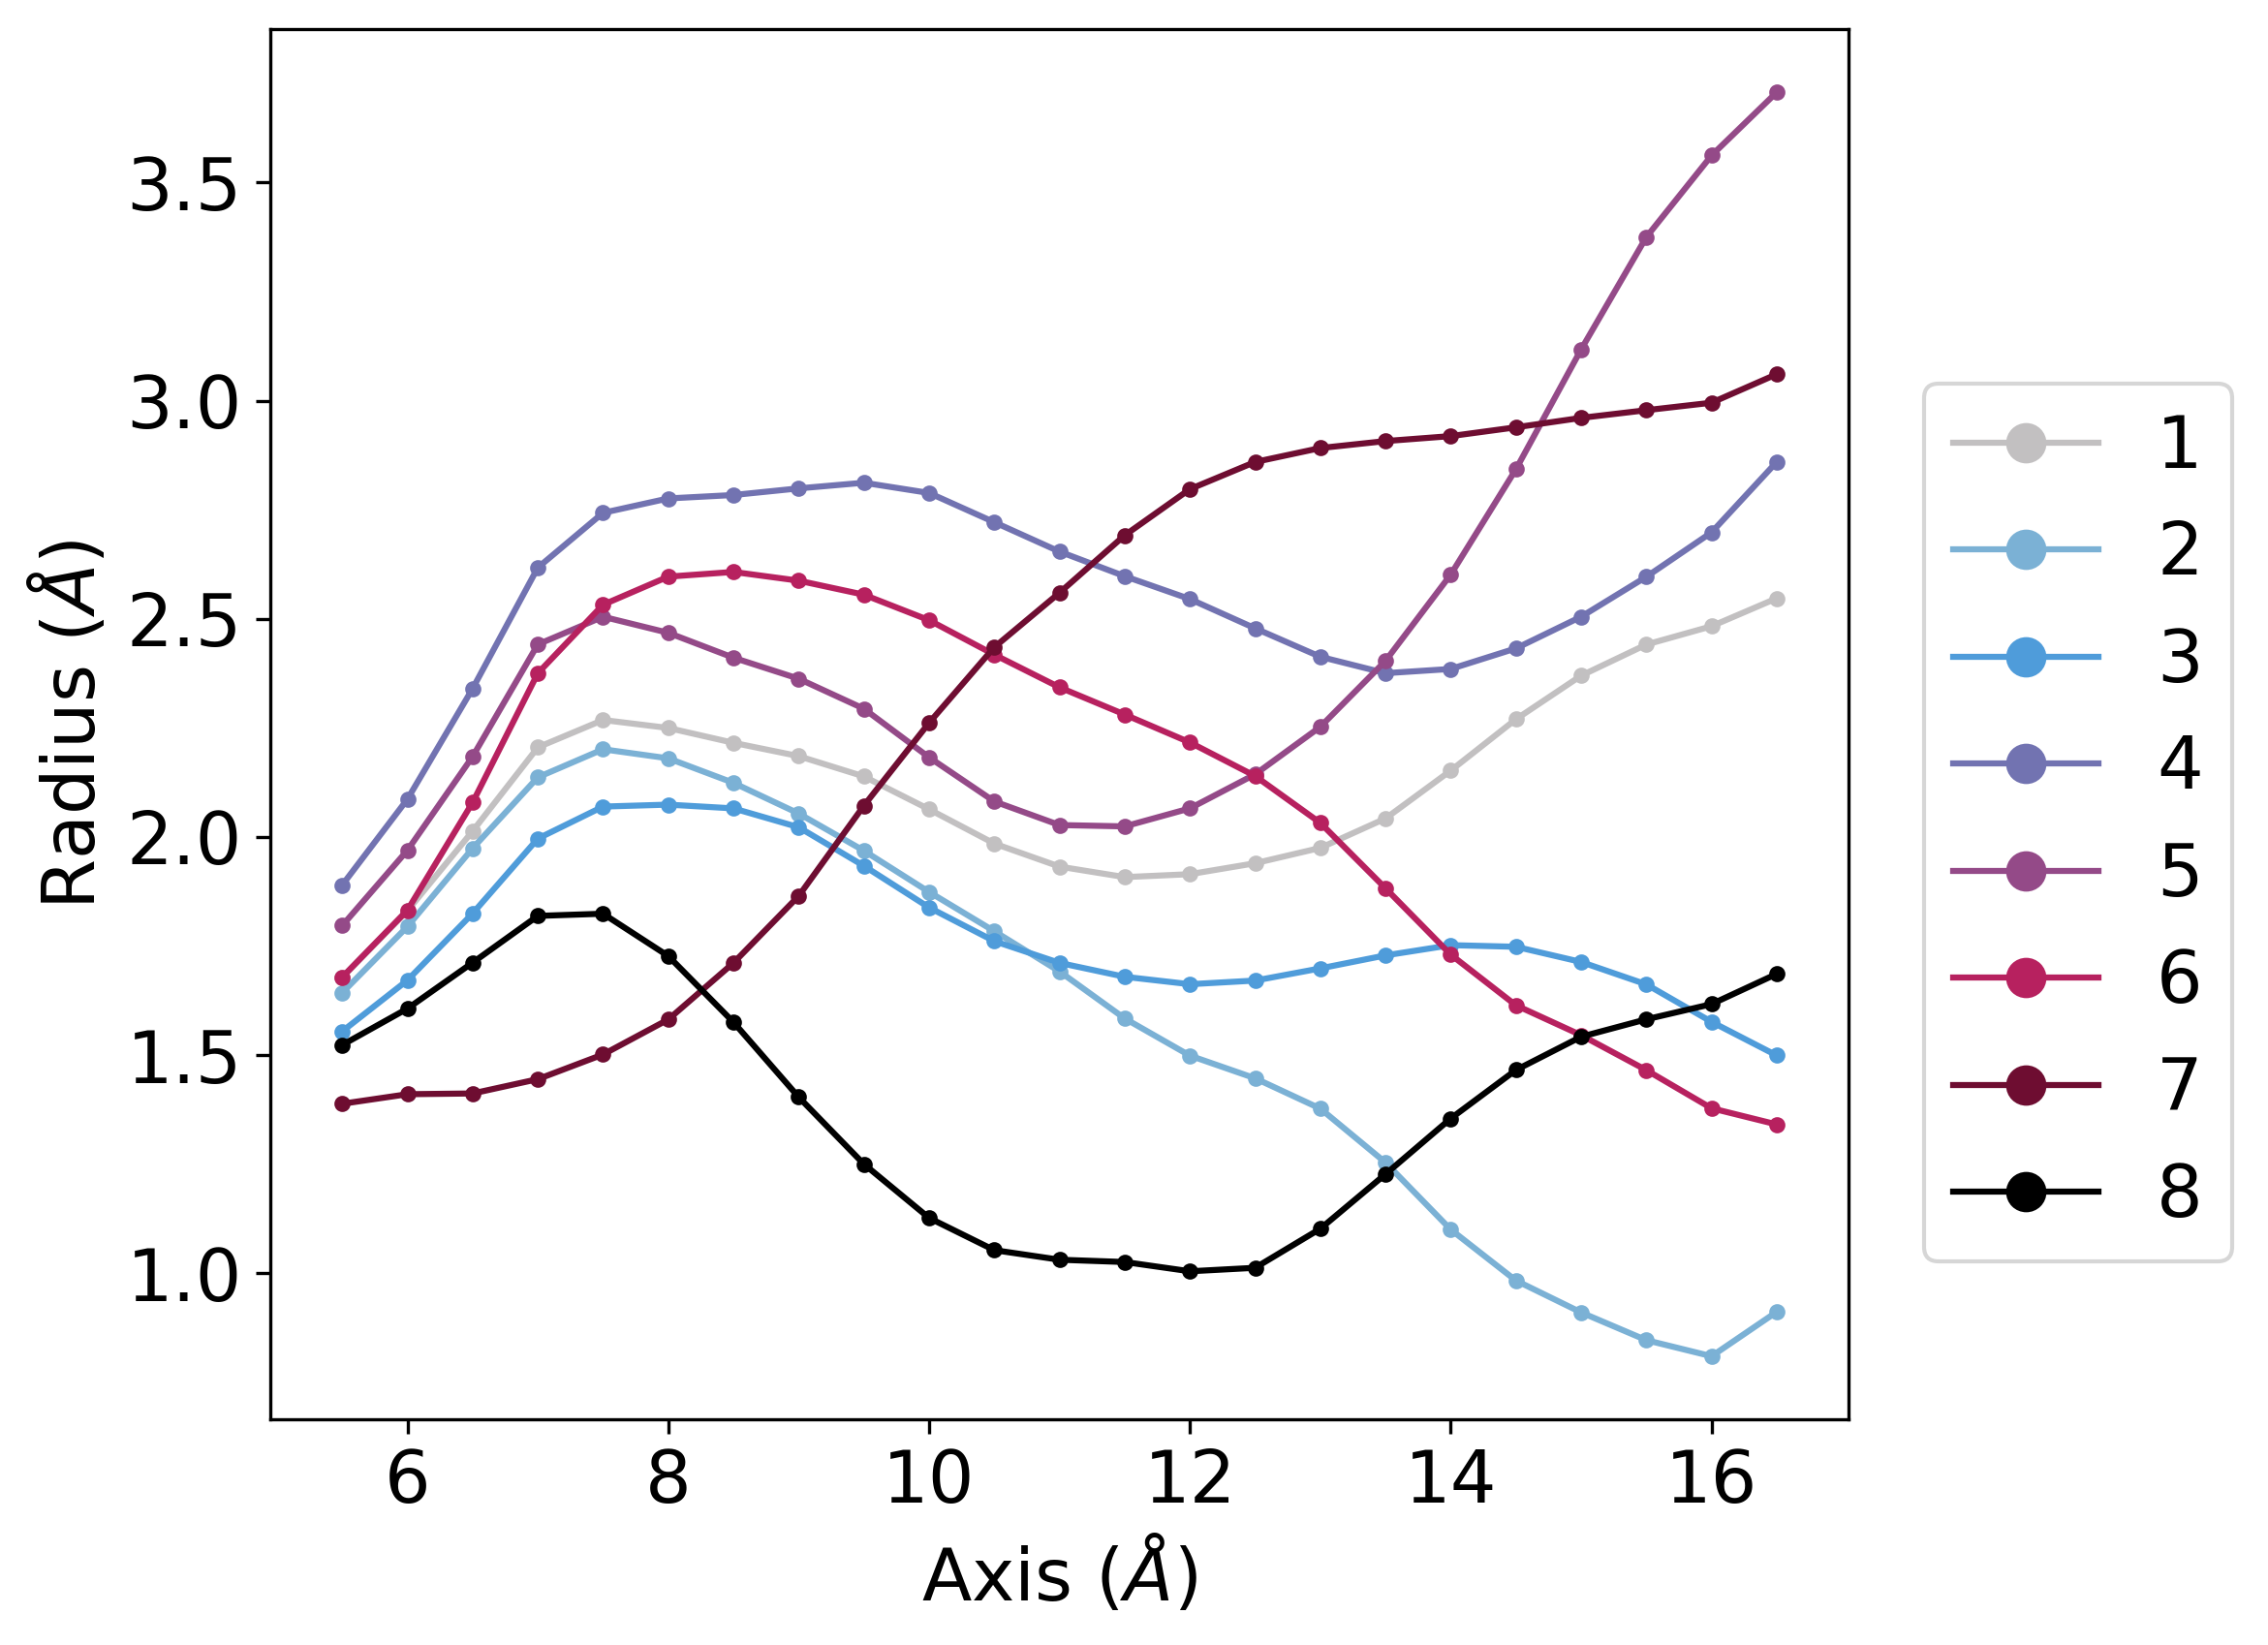
Calculating and plotting average cavity radius cluster-wise
Visualizing clustered cavity shapes
1. Calculating and plotting average cavity radius cluster-wise
gmx_clusterByFeatures holeclustersplot can be used to plot the average radius of each clusters. The options to the sub-commands are as follows:
-xmin- minimum value of cavity/channel axis position to consider-xmax- maximum value of cavity/channel axis position to consider-endrad- ignore if radius is greater than this value (mostly at the opening end)-gap- slab size along the cavity/channel-ax- X, Y or Z axis along which cavity/channel axis is aligned-dl- Do not consider last two smallest clusters for calculation and plotting.-csv radius-clusterwise.csv- Dump the average and standard-deviation of each clusters’ radius to a csv file-o radius-cluster.png- Plot the average radius values from each cluster
[4]:
%%bash

gmx_clusterByFeatures holeclustersplot -i radius.dat -clid cluster-id-radius.xvg -o radius-cluster.png -csv radius-clusterwise.csv \
                                       -xmin 5.5 -xmax 17 -endrad 6 -gap 0.5 -ax Y -dl 2 -wd 8
Reading file : radius.dat
Reading frame 0 at time        0.000
Maximum axis range is: (5.500 to 17.000)
Reading frame 20000 at time  2000000.000
Finishid reading.... Total number of frame read =  22501
After removing axis points with any missing data:
------------------------------------------------------------
#        Axis        Mean radius     Std. deviation
------------------------------------------------------------
       5.500            1.629            0.384
       6.000            1.750            0.451
       6.500            1.907            0.534
       7.000            2.081            0.594
       7.500            2.146            0.631
       8.000            2.142            0.637
       8.500            2.127            0.610
       9.000            2.111            0.581
       9.500            2.085            0.569
      10.000            2.036            0.571
      10.500            1.984            0.567
      11.000            1.948            0.559
      11.500            1.925            0.561
      12.000            1.915            0.571
      12.500            1.916            0.574
      13.000            1.925            0.572
      13.500            1.938            0.595
      14.000            1.963            0.646
      14.500            2.001            0.715
      15.000            2.049            0.796
      15.500            2.088            0.884
      16.000            2.113            0.965
      16.500            2.178            1.044
------------------------------------------------------------
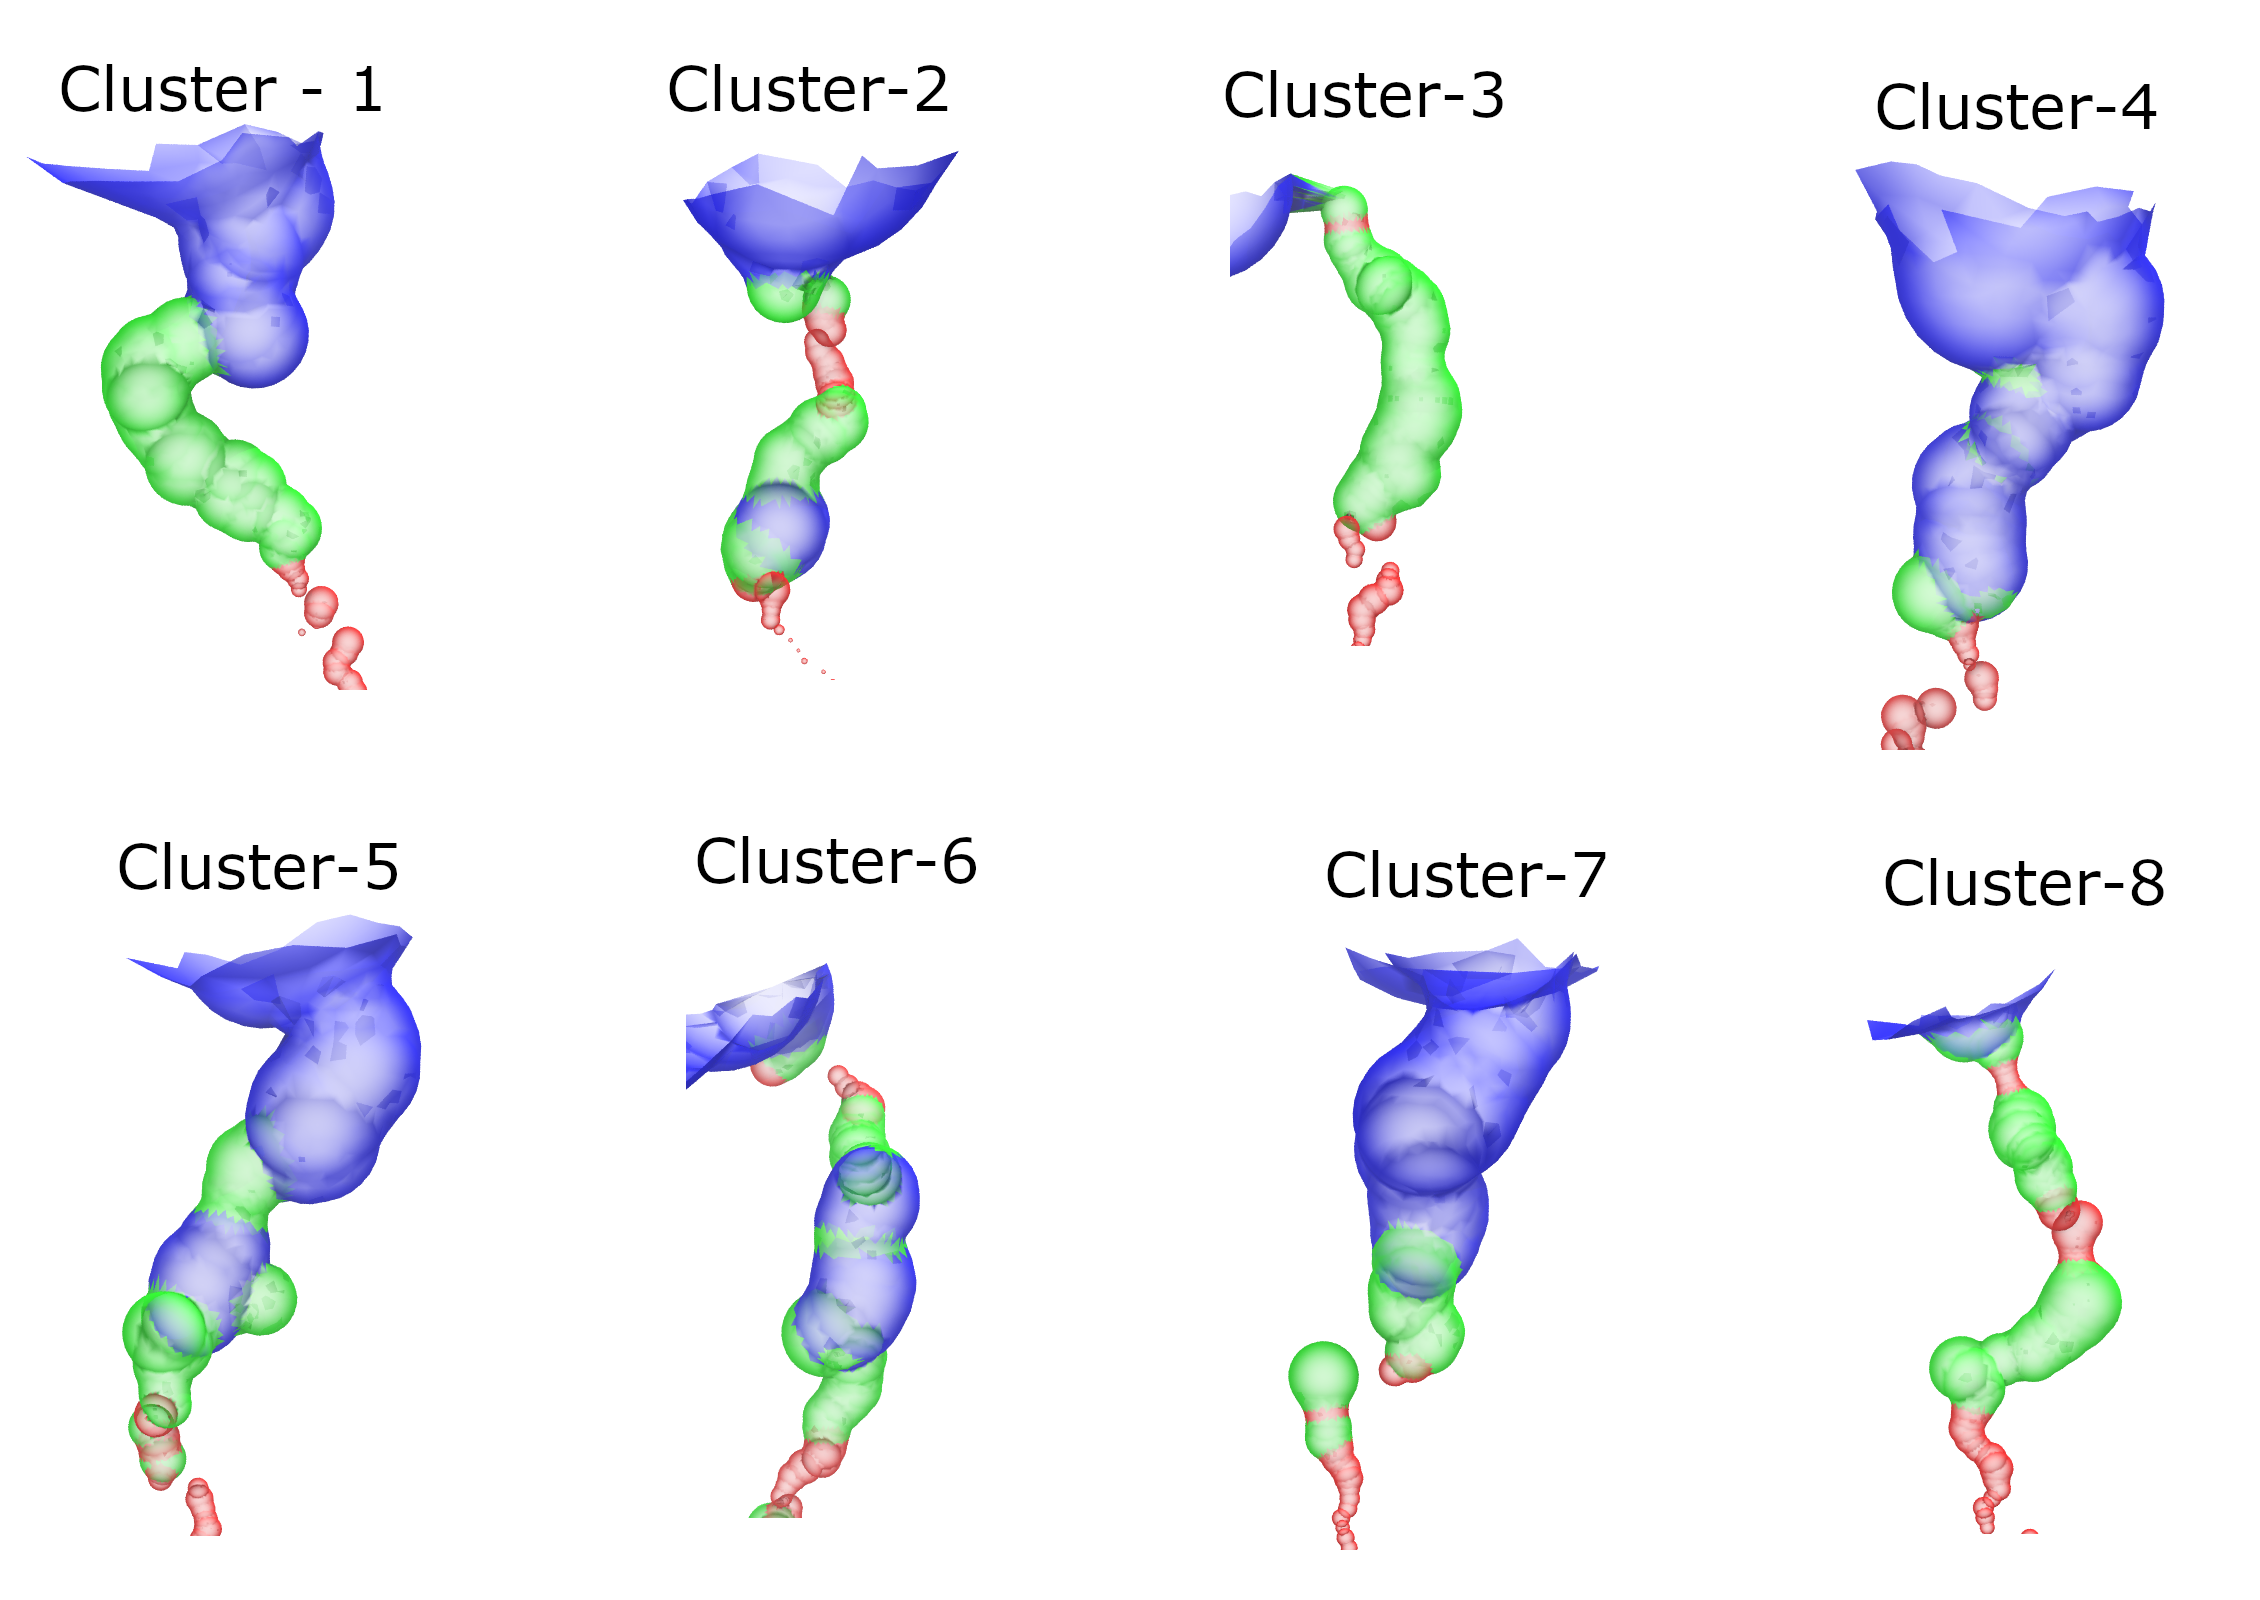
2. Visualizing clustered cavity shapes
To visualize the cavity shape of each cluster, we will use central structure pdb file and calculate the radius with same options as we did it originally with whole trajectory. This step also generate a pdb file with -pdb option containg cavity shape.
Subsequently, we will use sph_process and sos_triangle tools (provided with HOLE package) to generate a file that can be used to draw the cavity in the VMD.
Note: Remove %%capture --no-stdout and %%capture --no-stderr to populate all the output and errors generated from these commands.
[5]:
%%capture --no-stderr
%%capture --no-stdout
%%bash

for i in 1 2 3 4 5 6 7 8
do
input=central_c${i}

echo 11 1 | gmx_clusterByFeatures hole -f clustering-radius-output/${input}.pdb -s inputs/ref_cavity.pdb -n inputs/onlyProtein.ndx -rad bondi \
                                       -catmid 1903 -cvect 0 1 0 -endrad 12 -sample 0.5 -pdb ${input}_sph -o dummy_radius.dat
mv ${input}_sph.pdb ${input}.sph

rm ${input}.sos ${input}.vmd_plot dummy_radius.dat
sph_process -sos -dotden 15 -color ${input}.sph ${input}.sos
sos_triangle -s < ${input}.sos > cavity-snapshots/${input}.vmd_plot
rm ${input}.sph ${input}.sos
done
Visualizing cavity shape using VMD
Above commands generate cluster_<cluster_id>.vmd_plot files that can be loaded in VMD to visualize the cavity.
Go to the cavity-snapshots library
At first load the central strucure by using follwoing command:
vmd ../clustering-radius-output/central_c1.pdb -e snap.vmd. This command will load central structure of first crystal structure and sets several representations.In VMD Main Window, click on
Analysis -> Extensions -> Tk Console. It will open the Tk console. Writesource central_c1.vmd_plotand it will plot the cavity.